 |
Black Mountains MAPS & HEIGHTS 16-18 October 2015 |
|
| Features Where? Map Heights Facts Gradients More Timing Files Postscript Read Me |
Features of Our Walks - Castell Dinas, Waun Fawr, Cwmdu
The three walks for which I give more detailed descriptions here, are walks in which I participated. All were circular walks conveniently centred on our hostel and show what a good walking and activity centre Jim picked for us. The walks were on our doorstep. They were led by Tony (Friday), Jim (Saturday) and myself and Gavin (Sunday). We had good walking weather and terrain conditions, and of course, nice scenery. Occasionally we encountered an over enthusiastic summer inheritance in the form of ferns and bracken covering a few paths - but what's that to seasoned CLOGgies?! I felt that these walks could be comfortably undertaken by most able-bodied persons - even by someone like me!.
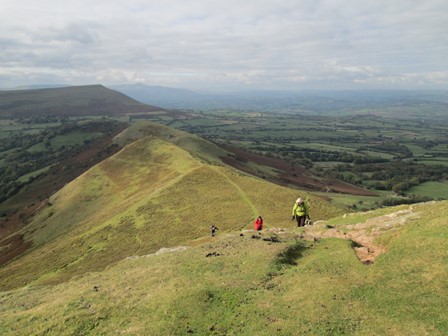
This is looking back on part of our ascent to Waun Fawr on Saturday.
The OS does remarkably well when it comes to showing tracks in mountainous regions,
for such tracks are often less well defined than footpaths in populated lower level areas.
Now prepare ye for some plots and graphs. Not too overwhelming, but hopefully quite interesting! You will see here:
- Where is Cymfforest?
- An Outline Map of Our Walks
- Height Profile of Our Walks
- Some Facts and Figures
- Average Rising and Falling Gradients
- Less Quantifiable Considerations
- Timing & Speed
- Track Files
- Postscript
Where is Cymfforest?
Cymfforest is a hamlet in the Black Mountains in South Wales. It it just to the south of the old hill fort of Castell Dinas and lies between Talgarth to the north and Crickhowell to the south. Cymfforest is about 135 miles, as the crow flies, and about 3½ hours by road, from Central London.
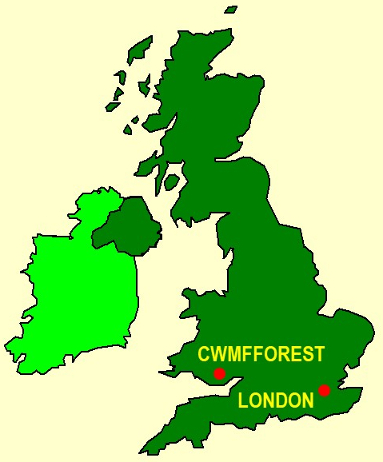
Here you see a "sketch" of the U.K. showing the approximate locations of Cymfforest and London.
This "map" is from the Microsoft® PowerPoint® Clip Art Library originally supplied with versions of MS_Office®.
If you espouse the quantitative in life, we have some numbers for you! What are these "great circle distances"? If you haven't met these before, I try, in my humble way, to give a little bit of an explanation below. However, this is probably not the place to wax unduly on the subject!
We take the centre of London as the intersection of The Strand, Whitehall and Cockspur Street. This intersection is often referred to as Charing Cross, not to be confused with the Victorian Eleanor Cross itself nor the station in front of which it stands.
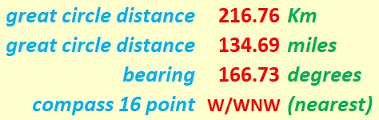
If you espouse the quantitative in life, here you duly see some numbers!
Essentially we are looking at the distance on a great circle of the earth between Charing Cross and Cymfforest, assuming the earth to be spherical, which is not far off the mark. Assuming the earth to be a sphere gives us an error of about 0.1% in our distance value. Not that much really! Can't complain! Indeed, we can speak of the distance as the "hypothetical crow" (cornix hypothetica) flies. And here is our avian navigator, with feats of endurance to match!

Cornix Hypothetica, our hypothetical crow,
isn't any old bird, as we should know.
Cornix Hypothetica! Many miles for us you go,
with many a "straight line" o'er Earth to show.
Outline Map of Our Walks
Our three circular walks shown here have numbers - like bus routes - corresponding to October 16, 17 and 18 (Fri, Sat, Sun). For the record, the first two walks were clockwise. Here are a few more numbers. The minus signs for the longitude angles indicate "degrees west of Greenwich". The map grid scales translate to 1.112 Km per 0.01° latitude and a mean of 0.689 Km per 0.01° longitude, all when using 6371.0 Km as the volumetric mean radius of the earth - as per the WGS84 standard!
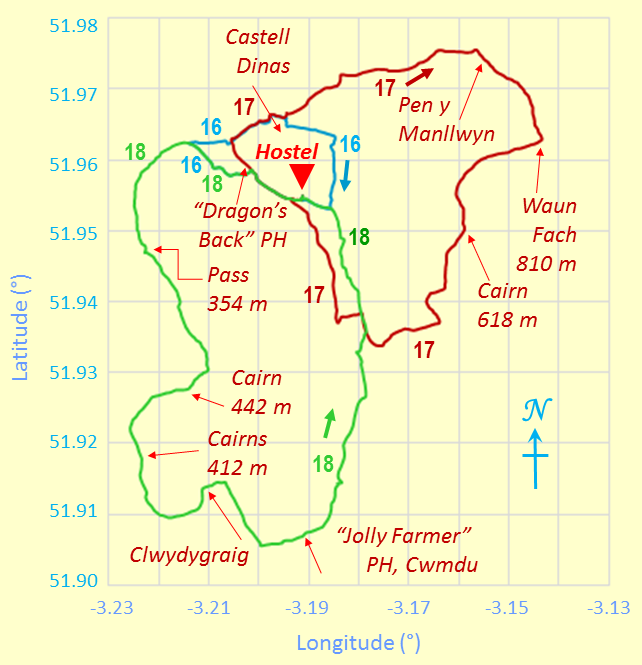
Outline Map of Walk
I plotted our walks by hand on my return home. While I tried to be reasonably accurate, even OS maps don't display all the possible paths on mountainous terrains. Added to this is the fact that occasionally we make - usually reasonably safe and legitimate - short cuts across open access terrain. However, thanks Jim for some useful info regarding our walking route on Saturday (October 17).
Because we don't live on a flat earth - unless you are a convinced "flat-earther" - maps are inevitably a distortion of what is. In other words, it's all a matter of mapping a curvaceous surface onto a flat surface. We don't want to carry curvaceous representations of the terrain on our walks, do we? In our case, the northern length of our map grid is stretched out by something like an extra 0.20 %, to make it the same on the page as the length of the southern part of our map grid. Not that much for hiking purposes really! Can't complain.
Height Profile of Our Walks
It's of course fine to say that we reached about 810 m (806 m with my hand plotting, if you must!), but what's the significance of that? I mean, we started at 267 m and on Sunday dipped below that level. Probably, of greater interest when it comes to considering personal achievements, is the total ascent, which of course, because of circularity, equals the total descent. But it's the ascent which usually requires greater effort, and over the three days, our total ascent on the walks shown here was about 1.4 Km or about 0.87 miles. This was over a total distance (projected onto a conceptual flat plane WGS84 style) of about 40⅓ Km or 25 miles.
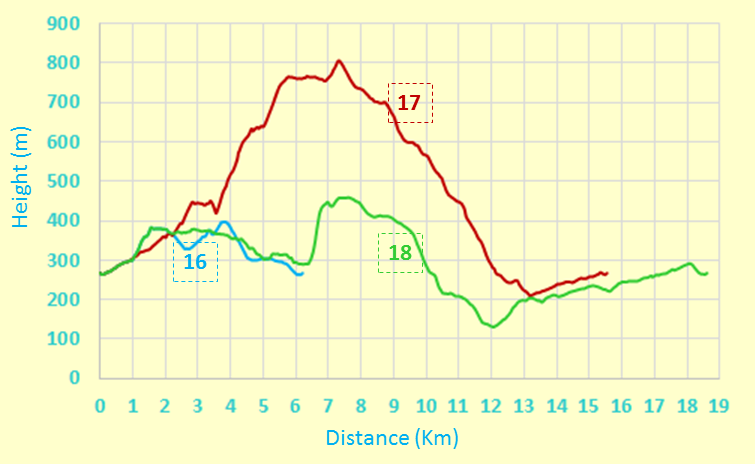
Height Profile
A further point. As you can see from the plot for the heights for Sunday's (October 18) walk, between about 6½ and 7 Km into our walk, we had quite a steep climb from about 300 to about 450 metres. I'll say something about the significance of this in the last paragraph of the section on Average Rising and Falling Gradients further below.
Some Facts and Figures
Here are some "vital statistics" in metric and imperial units. The total distance for each of our circular walks is measured on a conceptual "flat" plane at mean sea level, WGS84 style. Of course, for each walk, the total ascent exceeds the difference between maximum and minimum elevations; I'd suspect things, if the reverse transpired!
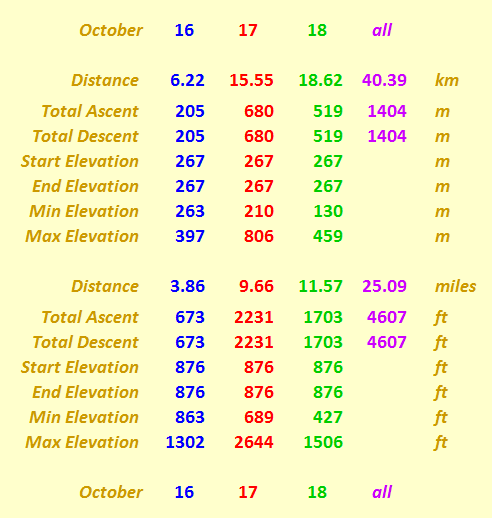
"Walk facts and figures"
Average Rising and Falling Gradients
And here, for the numerical fun of it, are the average gradients we overcame on our walk. The rising and falling (negative) gradients are both averaged over the distance given, with level stretches having rises and falls of less than ± ½ metre.
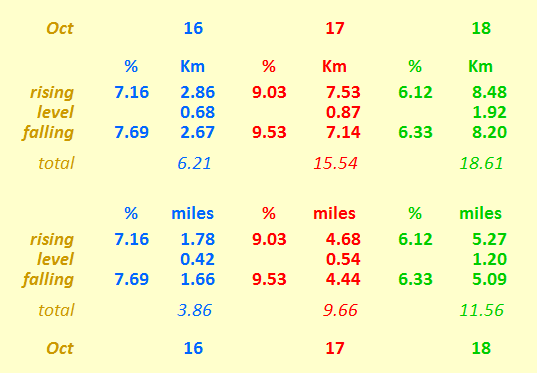
Rising and Falling Gradients
By comparison, Hertfordshire County Council recommends that its roads should not have longitudinal gradients of more than 5% and one of the steepest adhesion railways in the world, in Austria, has a maximum gradient of 11.6%. By way of further interest, the clockwise route of the Fairfield Horseshoe in the Lake District has a total distance of 15.62 Km (9.71 miles), with the following calculations: an average rising gradient of 14.66% over 6.589 Km, a level part over 0.345 Km, and an average falling gradient of 11.11% over 8.676 Km. This is seen by many as really quite challenging - but then, when you compare it with our walks in the Black Mountains, it can be said that we had a more leisurely and less demanding aim compared with Lakeland challenges!
A further point. As you can see from the plot for the heights for Sunday's (October 18) walk, between about 6½ and 7 Km into our walk, we had quite a steep climb from about 300 to about 450 metres. More precisely and accurately, we climbed 157 metres over a distance of 601 metres with a resulting average gradient (calculated for each distance sample) of 26.12%; this average gradient value was about four times our average gradient for our day walk. So what's the significance of this? Well, we were actually on a bridal path, indicating that horses were accustomed to such gradients - both ascending and descending. In Wales, it appears, horses are made of stern stuff!
Less Quantifiable Considerations
On any walk there are considerations which are very real but tantalizingly out of ready reach of those who wish to espouse a numerical approach to many of life's activities. Here are three considerations for starters.
- Weather: We had good walking weather. It stayed dry and on Saturday the sun was very much in evidence. The cloud seemed to come lower on Sunday, but even then we still managed to reach about 460 m (1500 feet) above sea level (cf. OS Newlyn post-WW1 reference measurements) with good views and good visibility for the purposes of safety. Compared with Sunday, Saturday was sunnier but windier.
- Ground Conditions: We had firm ground with very little mud. In wooded areas we occasionally encountered an over enthusiastic summer inheritance in the form of ferns and bracken covering a path; this was manageable and added an additional sense of adventure, while not impinging unduly on our forward progress.
- Signposting: This was mainly of the type "here's a bridal path" or "here's a foot path". Actual destinations were not over liberally sprinkled amongst the sign post population, but many of us had maps anyway!
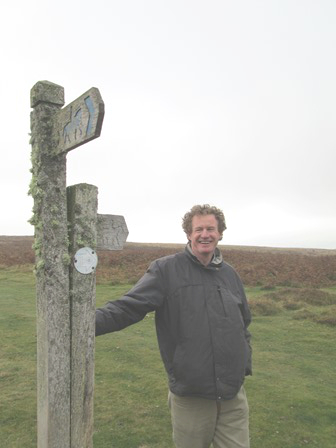
This is Danny next to a very weathered signpost on Cefn Moel.
Timing and Speed
It's one thing to discuss the terrain over which we walk. It's quite another to ask how we personally respond to walking over that terrain. There are a number of considerations, of which timing and speed can be taken as starting points.
- Timing: Starting and finishing at our hostel made timing logistics reasonably straight forward. On a full day (Saturday and for some of us also Sunday) we would start between 09:15 and 09:30, returning between 15:30 and 16:30. There was no night-time walking!
- Speed: We made sure that we had a comfortable enough pace to enjoy the landscape and photo-opportunities and of course, each others' company. Thus, assuming an hour in total for lunch, water and "Kodak Moment" breaks, our walking speeds ranged between 1½ and 2 mph - quite reasonable, considering the mountainous terrain which we traversed. We were not on a military or a "fitness proving" exercise after all!
Now fleet of foot is the kangaroo.
Is this how we our hikes should do?
Track Files
If you are keen to see our walks superimposed on Ordnance Survey® (OS) maps, then you can use the following files to do so. As mentioned above, the numerical data in these files have been hand-plotted by me (no GPS!) on my return to the south-east. The data are based on WGS84. For copyright reasons, I do not show the OS-based maps here.
Postscript
Any map is an approximate representation of what is, and my plotting thereon certainly is. Practicality and scale are relevant considerations. We are not dealing with a planning application calling for detailed spatial descriptions of intricate boundaries. For us in the hiking community, the degrees of accuracy and precision should be just enough to give us useable and helpful knowledge of the terrain about us and beneath our feet. I hope my humble endeavours on this page are in this respect interesting for, and useful to, you my reader!
Eric Scharf
Original: 2015-08-18 @15:20
Updated: 2019-01-26 @23:42
SAGAX REX HANC RETIS ORBIS PAGINAM PINXIT ANNO MMXV ET MMXIX.
© Eric Scharf 2019